What Are the Best Trading Strategies for Beginners to Learn First?
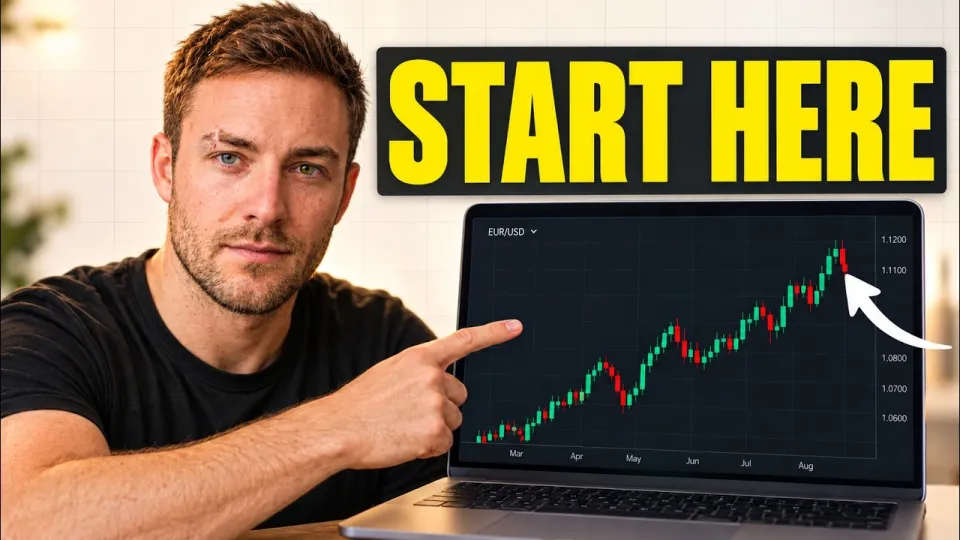
Video: How to Read Candlestick Charts for Trading | Trading strategies for beginners (Step by Step)
· based on the channel Trade with Smoke FX
Key takeaways
- A candlestick shows four prices per period: open, high, low and close; the body is open-to-close, the wicks are the extremes.
- Support and resistance are horizontal zones drawn from repeated highs and lows, not single exact prices.
- Long wicks against your direction signal rejection: sellers or buyers defending a level.
- A setup is not an entry: beginners should wait for confirmation and predefine stop loss and take profit.
- Risk per trade should be a fixed small percentage of the account, decided before the position is opened.
Trading strategies for beginners should start with price itself: learn to read a candlestick chart, mark support and resistance, interpret wicks, and only then add indicators or signals. The core skill is deciding whether buyers or sellers control price at a specific level, and every beginner strategy is built on that judgment plus a predefined stop loss and take profit. A free community where these setups are discussed live is available at the Smoke FX Telegram community.
What a candlestick actually tells a beginner
Each candle packs four prices from one time period into a single shape: the open, the high, the low and the close. The rectangular body spans open to close, and the thin lines above and below — the wicks or shadows — mark the highest and lowest price reached during that period.
A green or white body means the close finished above the open (buyers won the period); a red or black body means the close finished below the open (sellers won). A long body shows conviction and momentum. A small body with long wicks on both sides shows indecision and a fight between the two sides.
The timeframe changes the meaning, not the mechanics. A five-minute candle condenses five minutes of trading, a one-minute candle condenses one minute, and a five-second chart compresses seconds. Beginners should pick one timeframe, usually 5-minute to 1-hour on a major pair such as EUR/USD, and stay there until the reading becomes automatic.
A practical first exercise:
- Open a chart of EUR/USD on the 15-minute timeframe.
- For each of the last 50 candles, write down whether the body is bullish or bearish and whether the wick is larger on top or bottom.
- Mark the candles with unusually long wicks and note what price did in the next few candles.
This builds pattern recognition before any money is at risk.
How to draw support and resistance without clutter
Support is a price zone where falling price repeatedly stopped and buyers stepped in; resistance is a zone where rising price repeatedly stalled and sellers took over. These zones are the backbone of price action trading for beginners because they give every candle context.
Draw them from structure, not from imagination:
- Zoom out to a higher timeframe, such as the 4-hour or daily chart.
- Find at least two, ideally three, swing highs or swing lows that line up at roughly the same level.
- Draw a horizontal band across the bodies and wicks rather than a single hairline.
- Return to your trading timeframe and keep only the two or three zones closest to current price.
A zone that has been tested many times is not automatically stronger — each test consumes the orders resting there. A clean level touched twice often produces a clearer reaction than a level that has been hammered a dozen times.
Reading wicks to judge who controls price
A wick is a record of rejected price. A long upper wick means buyers pushed price up and sellers forced it back down before the candle closed; a long lower wick means sellers pushed down and buyers absorbed the move.
In a live EUR/USD example built around support and resistance, the telling detail was a candle with a long upper wick pressing into a resistance zone while vertical volume rose. That combination — rejection at a level plus participation — pointed to sellers being in control, which is the logic behind a short or put-style trade in that area.
For beginners, the usable rules are simple:
- A long wick into resistance that closes back below the level favors sellers.
- A long wick into support that closes back above the level favors buyers.
- A candle with a tiny body and wicks on both sides near a level is a warning, not a signal.
- A wick alone is not enough; it must occur at a level you already marked.
The same logic applies to breakouts. When price breaks a resistance zone, a candle that closes decisively beyond it and then retests the zone from above is far more reliable than a wick that pokes through and snaps back.
Turning a setup into a trade with defined risk
Spotting a pattern is not the same as entering; a setup becomes a trade only when entry, stop loss and take profit are defined in advance. This is where most beginners lose money — not because their chart reading is wrong, but because position size and exits are improvised.
A workable beginner routine:
- Identify the level and the candle reaction at it.
- Wait for confirmation, such as a close back inside the range or a rejection candle completing.
- Place the stop loss beyond the wick that created the setup, where the idea is proven wrong.
- Set take profit at the next opposing level, not at an arbitrary number.
- Size the position so that hitting the stop costs a fixed small percentage of the account, commonly 1% or less.
Skipping a trade counts as a decision. If price sits in the middle between support and resistance, or the candle gives no clear rejection, the correct action is often no action. A three-minute expiry on a binary-style trade still needs the same discipline: the chart timeframe must be short enough to show several candles inside that window, so a three-minute expiry is usually read on one-minute or shorter candles.
Do beginners need indicators or signals straight away
No — indicators are optional filters, not the foundation. Moving averages, RSI or volume panels can confirm momentum, but they are all calculated from price, so learning raw candles and levels first prevents the common trap of trading an indicator that lags the move.
Signals deserve the same caution. A signal is only as good as the reasoning behind it: which level, which candle, which invalidation point. When a forecast is shared, the useful part is the reasoning — for example, a EUR/CAD breakout idea is worth studying because of where the level was drawn and where the idea would be invalidated, not because someone posted a direction. Reviewing how past forecasts actually played out is one of the fastest ways to learn.
Automated chart scanners are a similar tool. They can flag candidate levels and patterns across pairs such as GBP/USD, but they need clean, well-defined rules and human confirmation to be useful; a scanner that highlights a zone still leaves the entry decision to the trader.
Common beginner questions answered in practice
Beginners usually ask the same handful of things, and the answers are more mechanical than they expect.
- How do I read a signal? Check the level, the candle reaction, the entry, the stop and the target. If any of those is missing, treat it as an idea to study, not a trade to copy.
- How are the lines drawn? From repeated swing highs and lows on a higher timeframe, drawn as zones rather than exact prices.
- When should a strategy be dropped? When it stops producing a positive expectancy over a meaningful sample, or when you cannot execute it consistently — not after two losing trades.
- Does a referral link cost extra? Registering through a broker referral link normally costs the trader nothing extra; the commission comes from the broker.
The unifying theme is decision-making. Price action has layers: structure, level, candle, confirmation, risk. Each layer narrows the decision until only one or two outcomes remain.
Where to follow the live breakdowns
The channel Trade with Smoke FX walks through these exact steps on live charts — support and resistance zones, wick reading, forecast reviews and short-timeframe trades — so the concepts above can be seen applied in sequence. Watching a level get marked, a wick get rejected and a stop get placed is the fastest way to convert theory into habit. Join the free community through the Smoke FX Telegram invite link to follow the discussion, and note that all of this content is educational only: trading carries significant risk and past performance does not guarantee future results.
Source: How to Read Candlestick Charts for Trading | Trading strategies for beginners (Step by Step) · Markdown version
Questions & answers
Can I enter a trade as soon as I spot a candlestick pattern?
No. A pattern is a setup, not an entry. You still need the pattern to form at a level you have already marked, a confirmation such as a completed rejection candle or a close back inside the range, and a predefined stop loss and take profit. Entering on the pattern alone removes the risk control that makes the trade measurable.
Do I need indicators to start reading charts?
Not at the beginning. Every indicator is derived from price, so learning raw candlesticks, wicks, support and resistance first gives you the foundation. Once you can judge who controls price at a level, moving averages, RSI or volume can be added as optional confirmation filters rather than as the reason for a trade.
How do I decide which timeframe to use for a short expiry trade?
The chart timeframe must be short enough to show several candles inside the trade duration. For a three-minute expiry, traders typically read one-minute candles or shorter so there is enough price information to judge the setup. Longer timeframes suit swing ideas where the target is the next major level.
How should I size a position as a beginner?
Fix the risk before entering: decide the maximum acceptable loss per trade, commonly 1% of the account or less, then size the position so the distance from entry to stop loss equals that amount. This keeps a single bad trade from damaging the account and makes results comparable across trades.